Julmos | Infographic

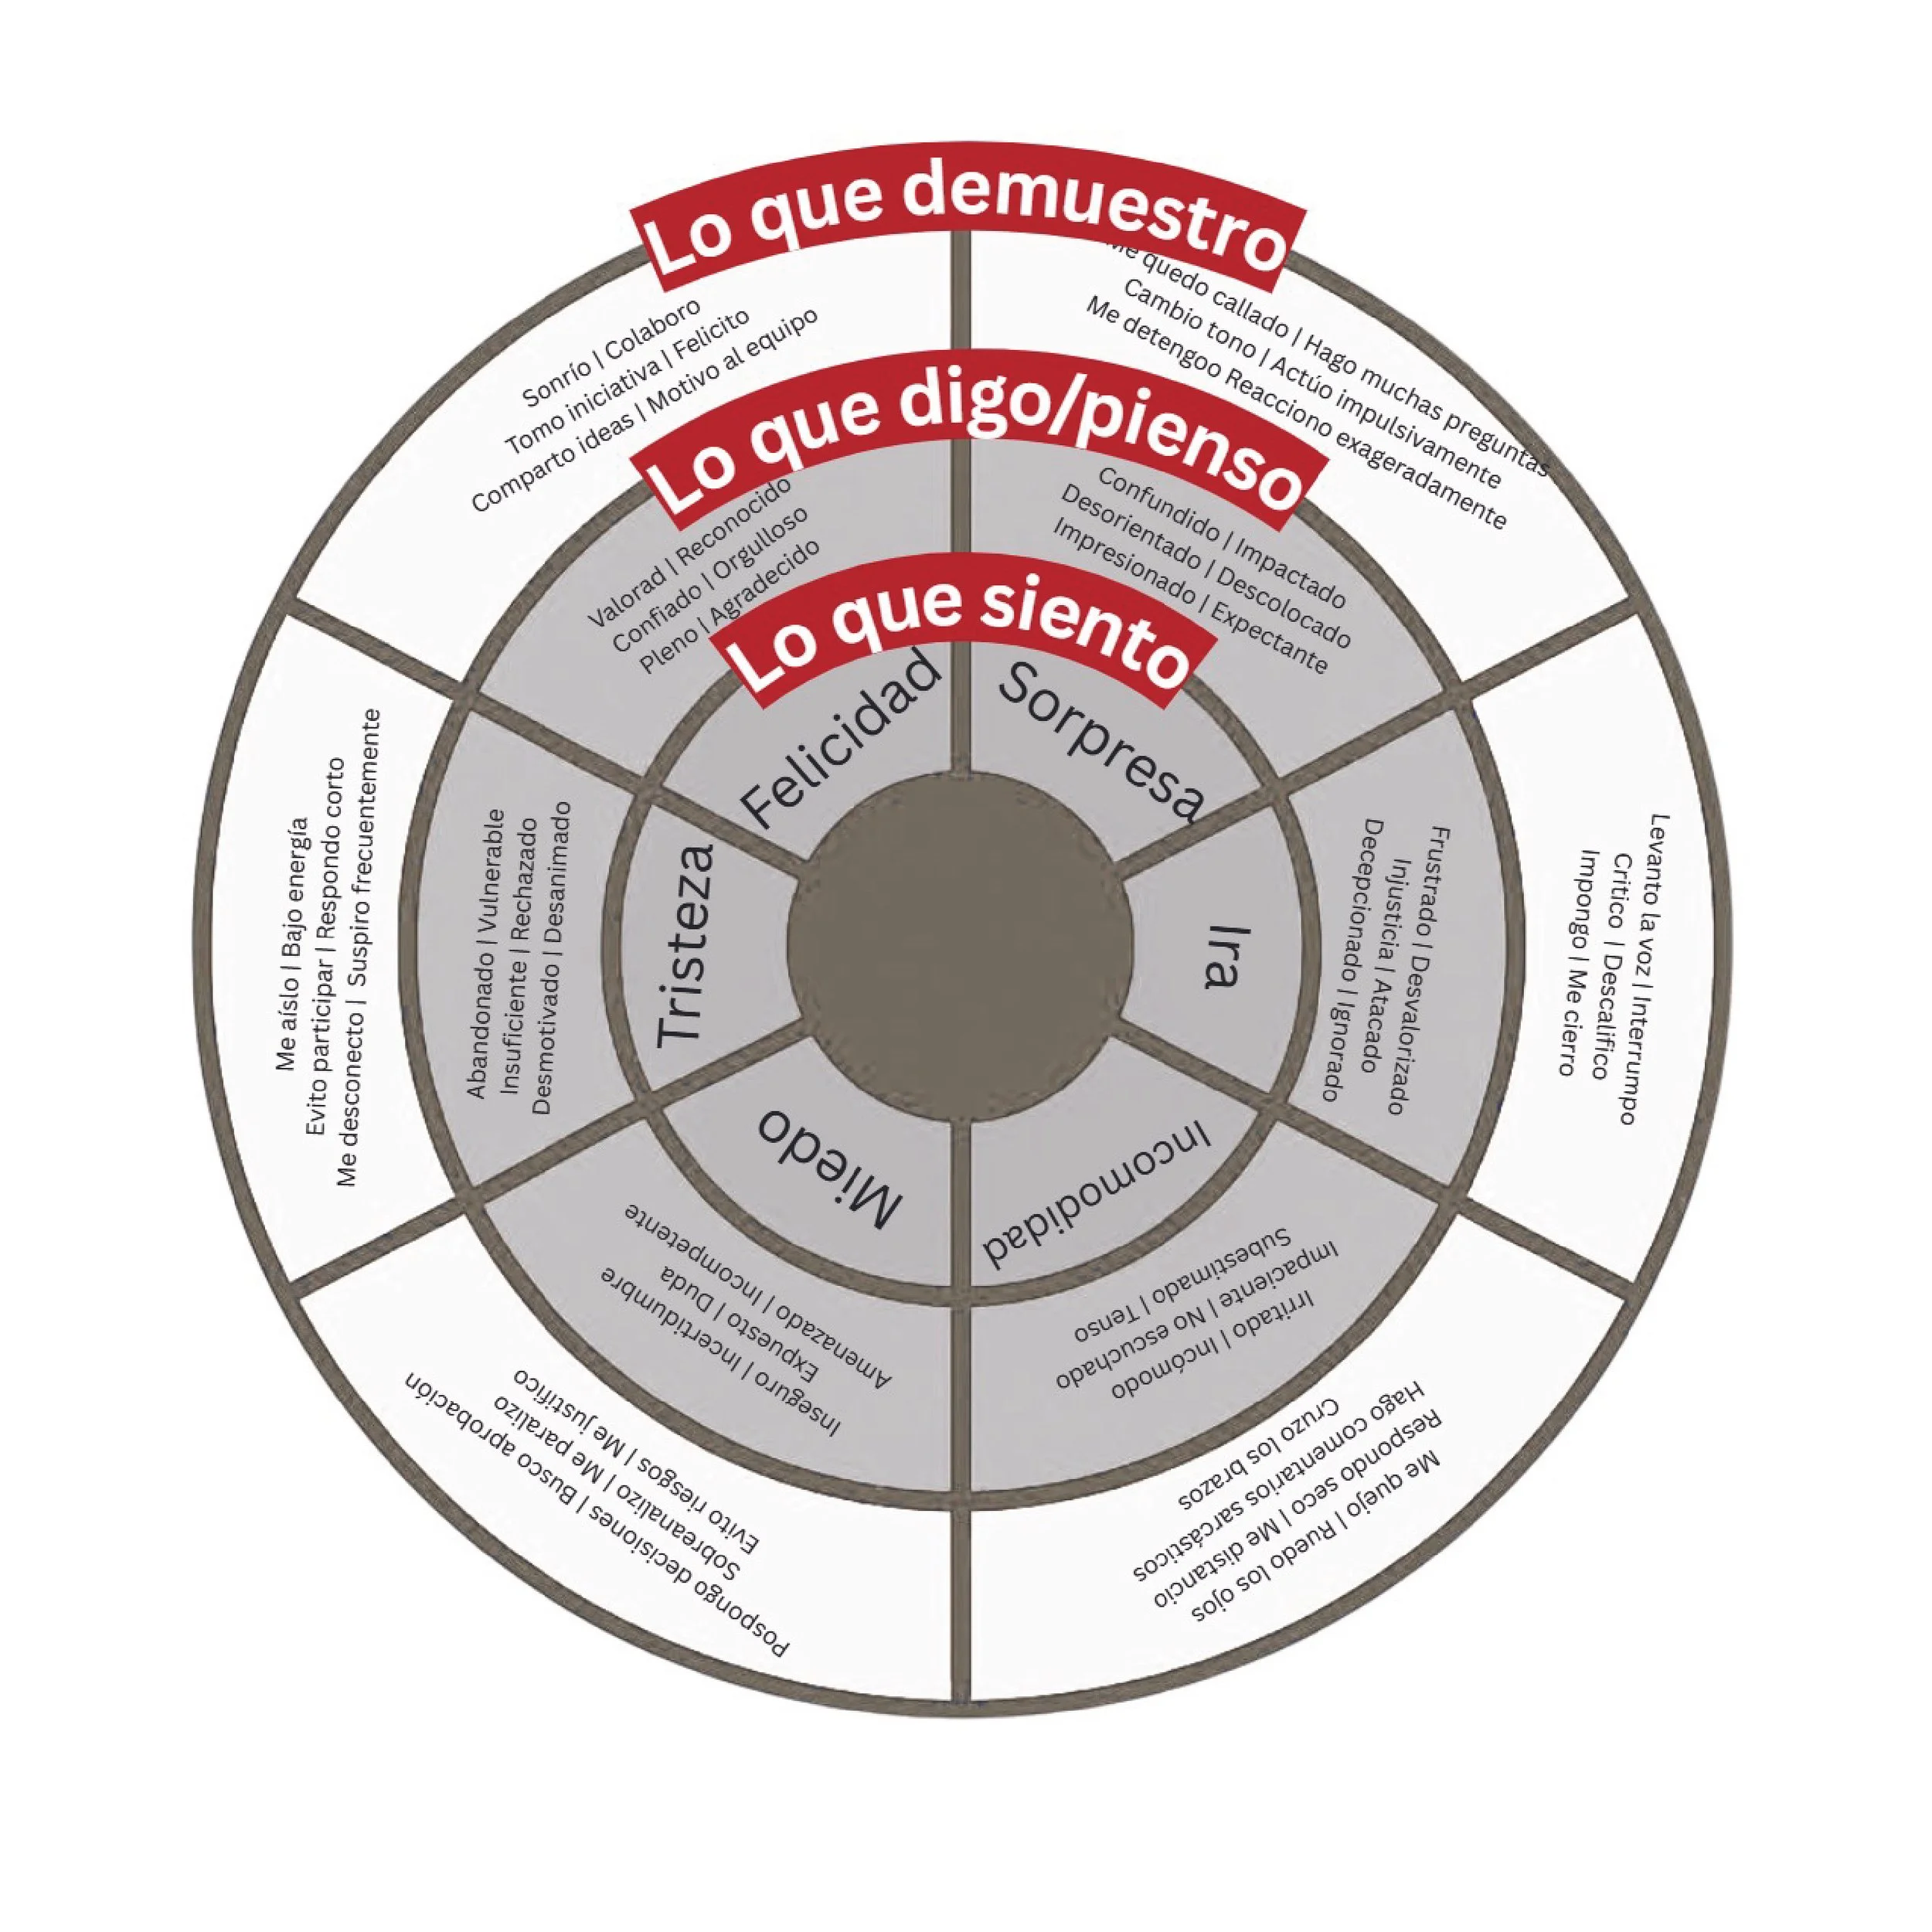
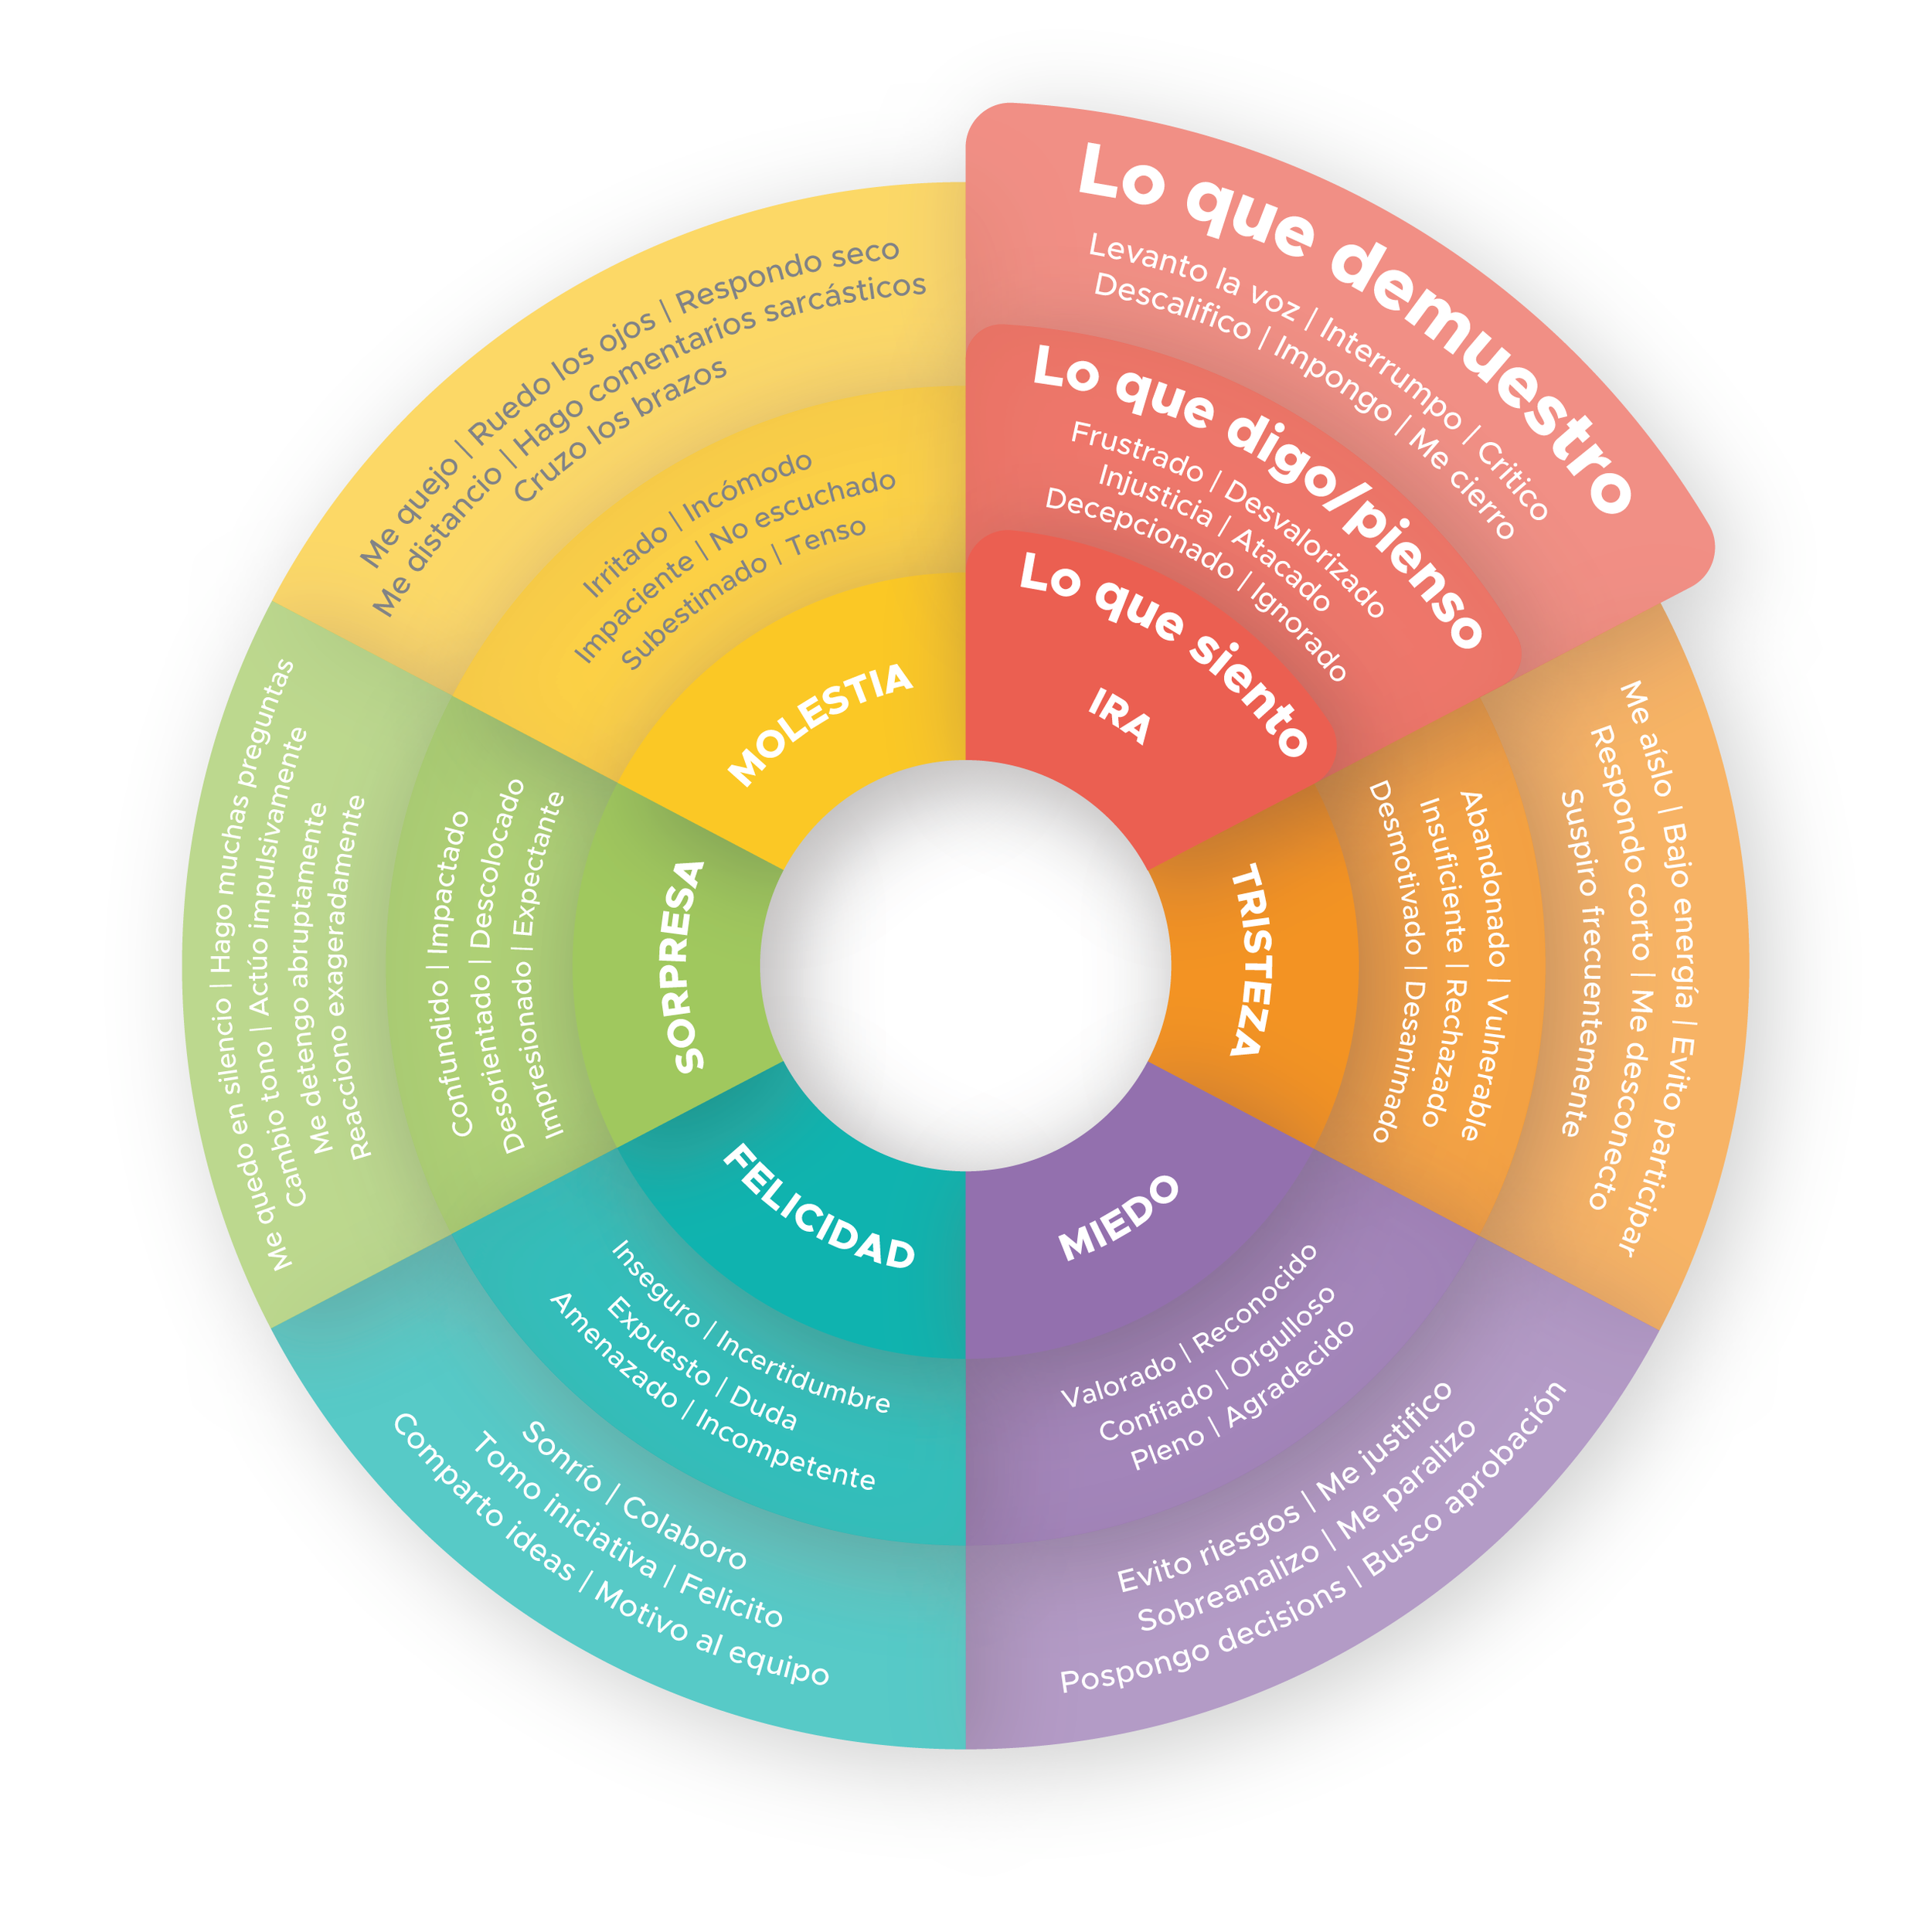
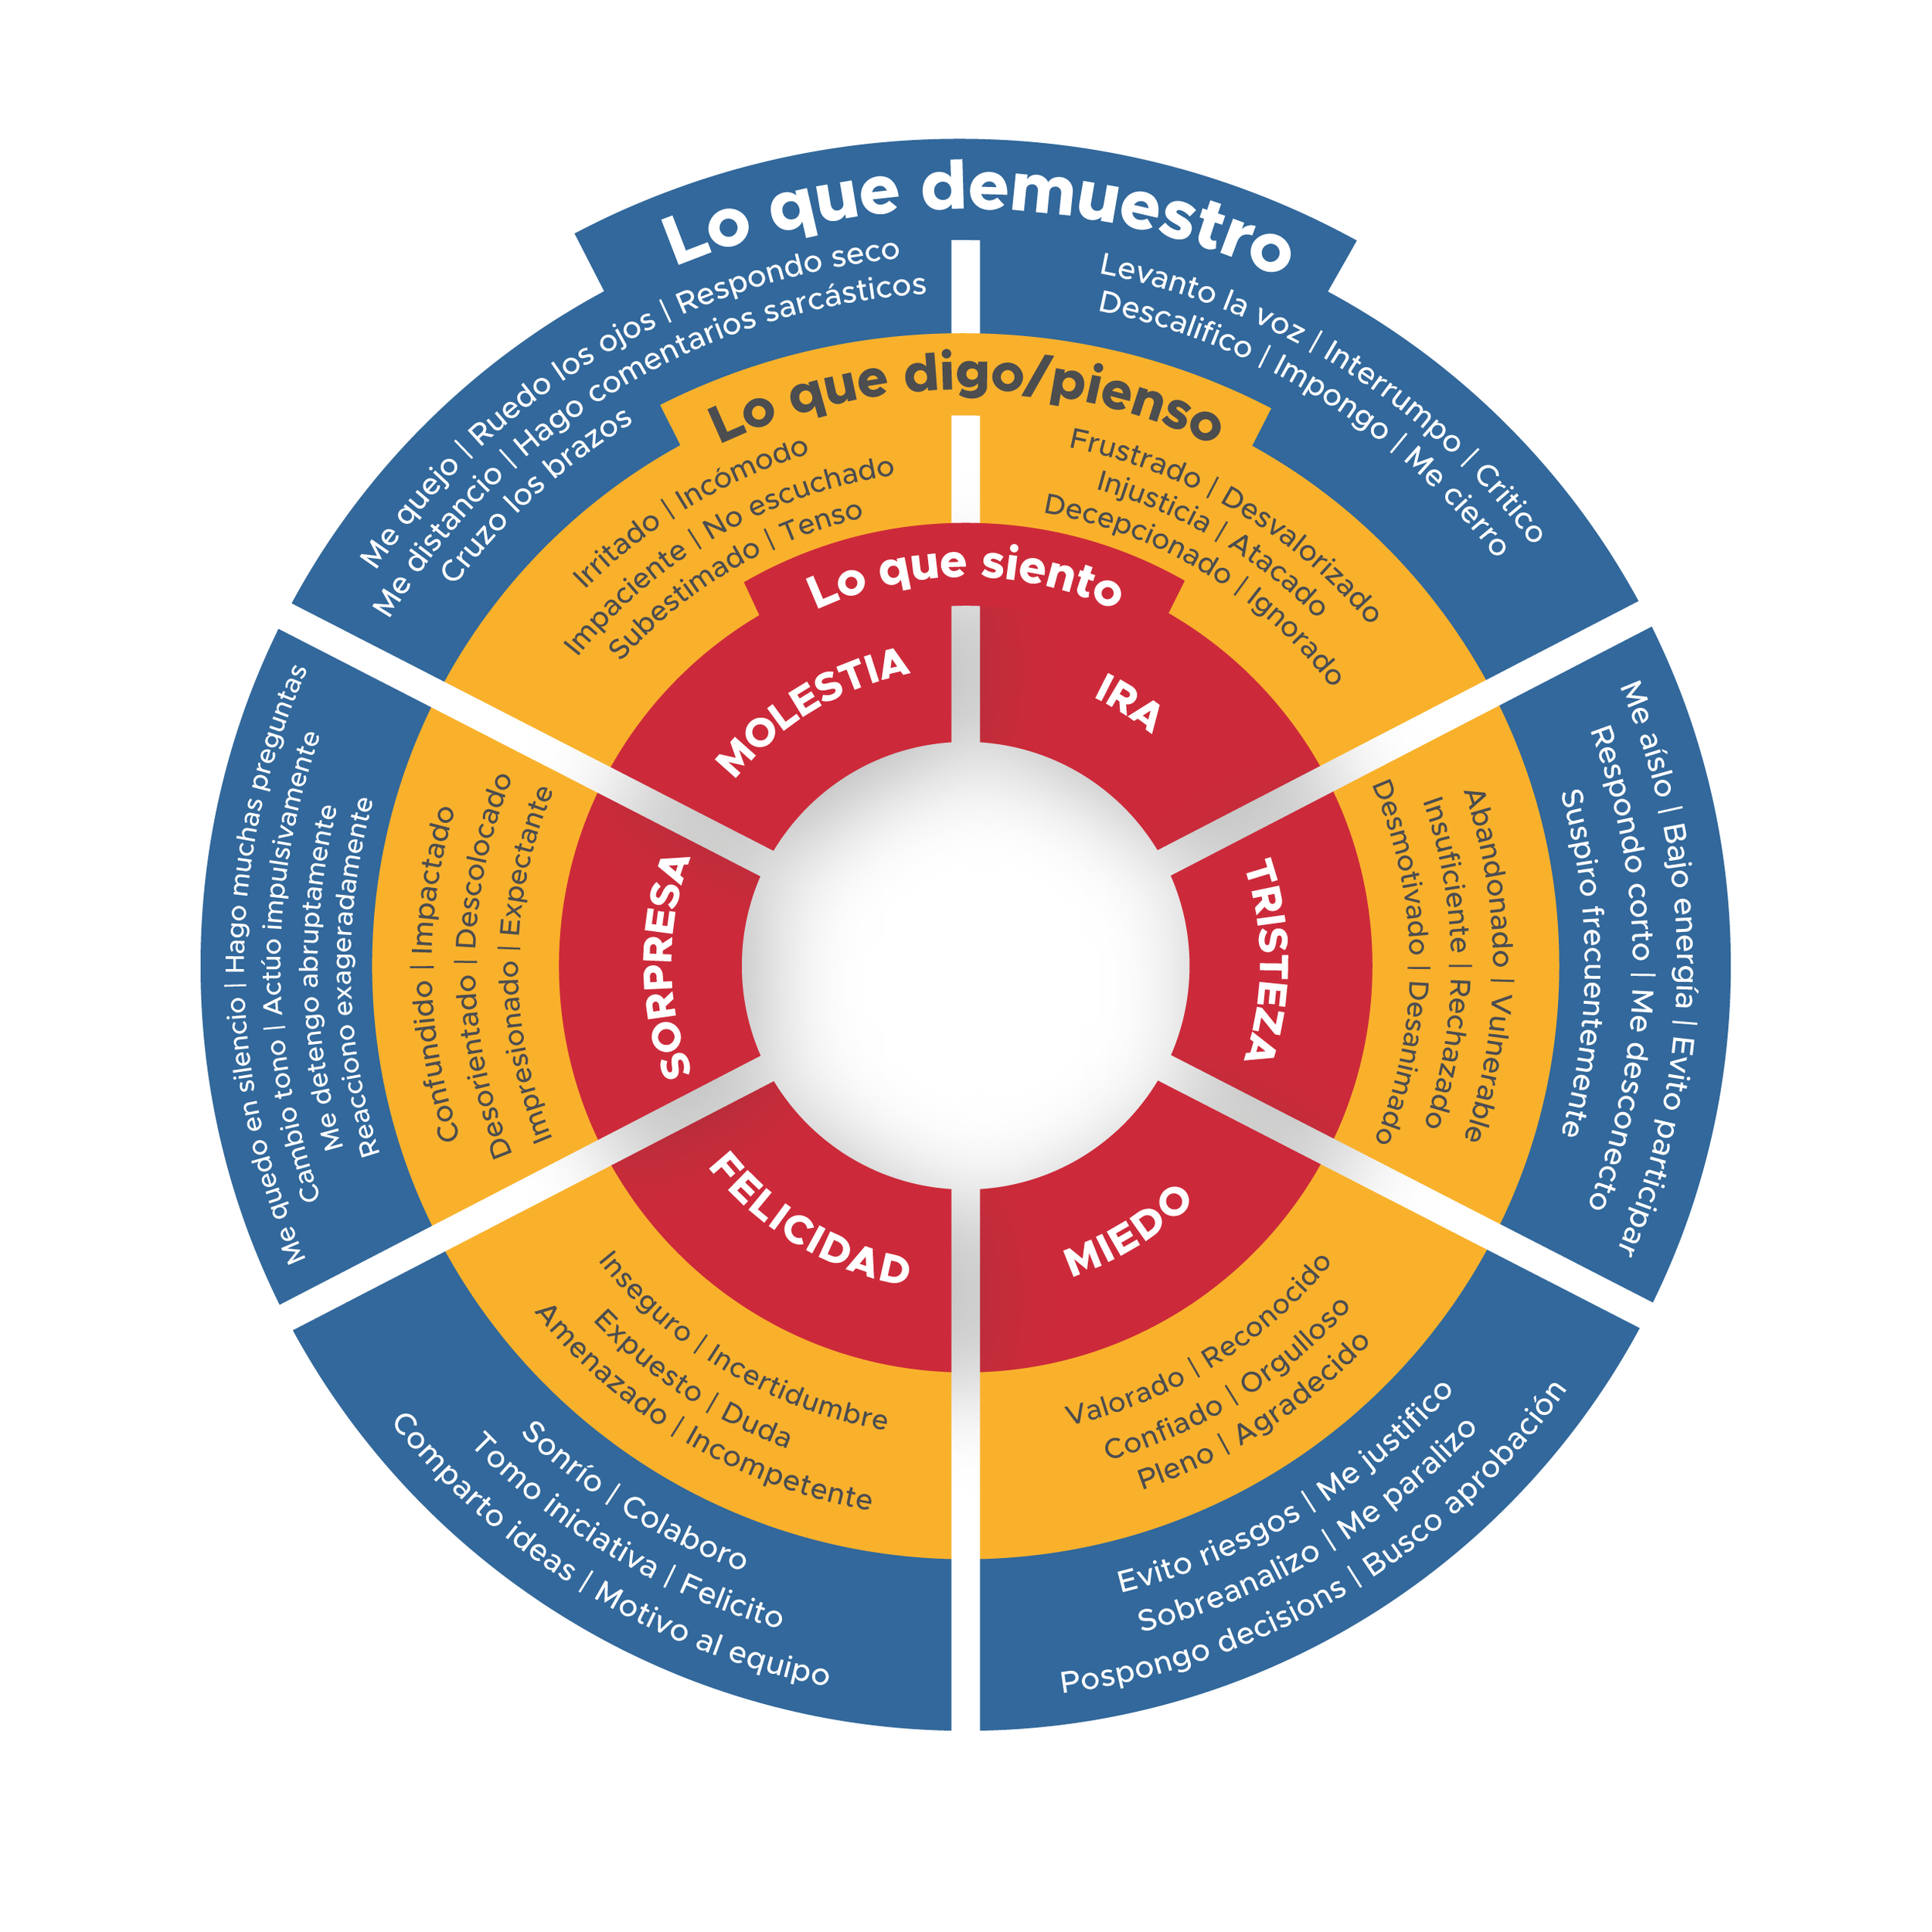
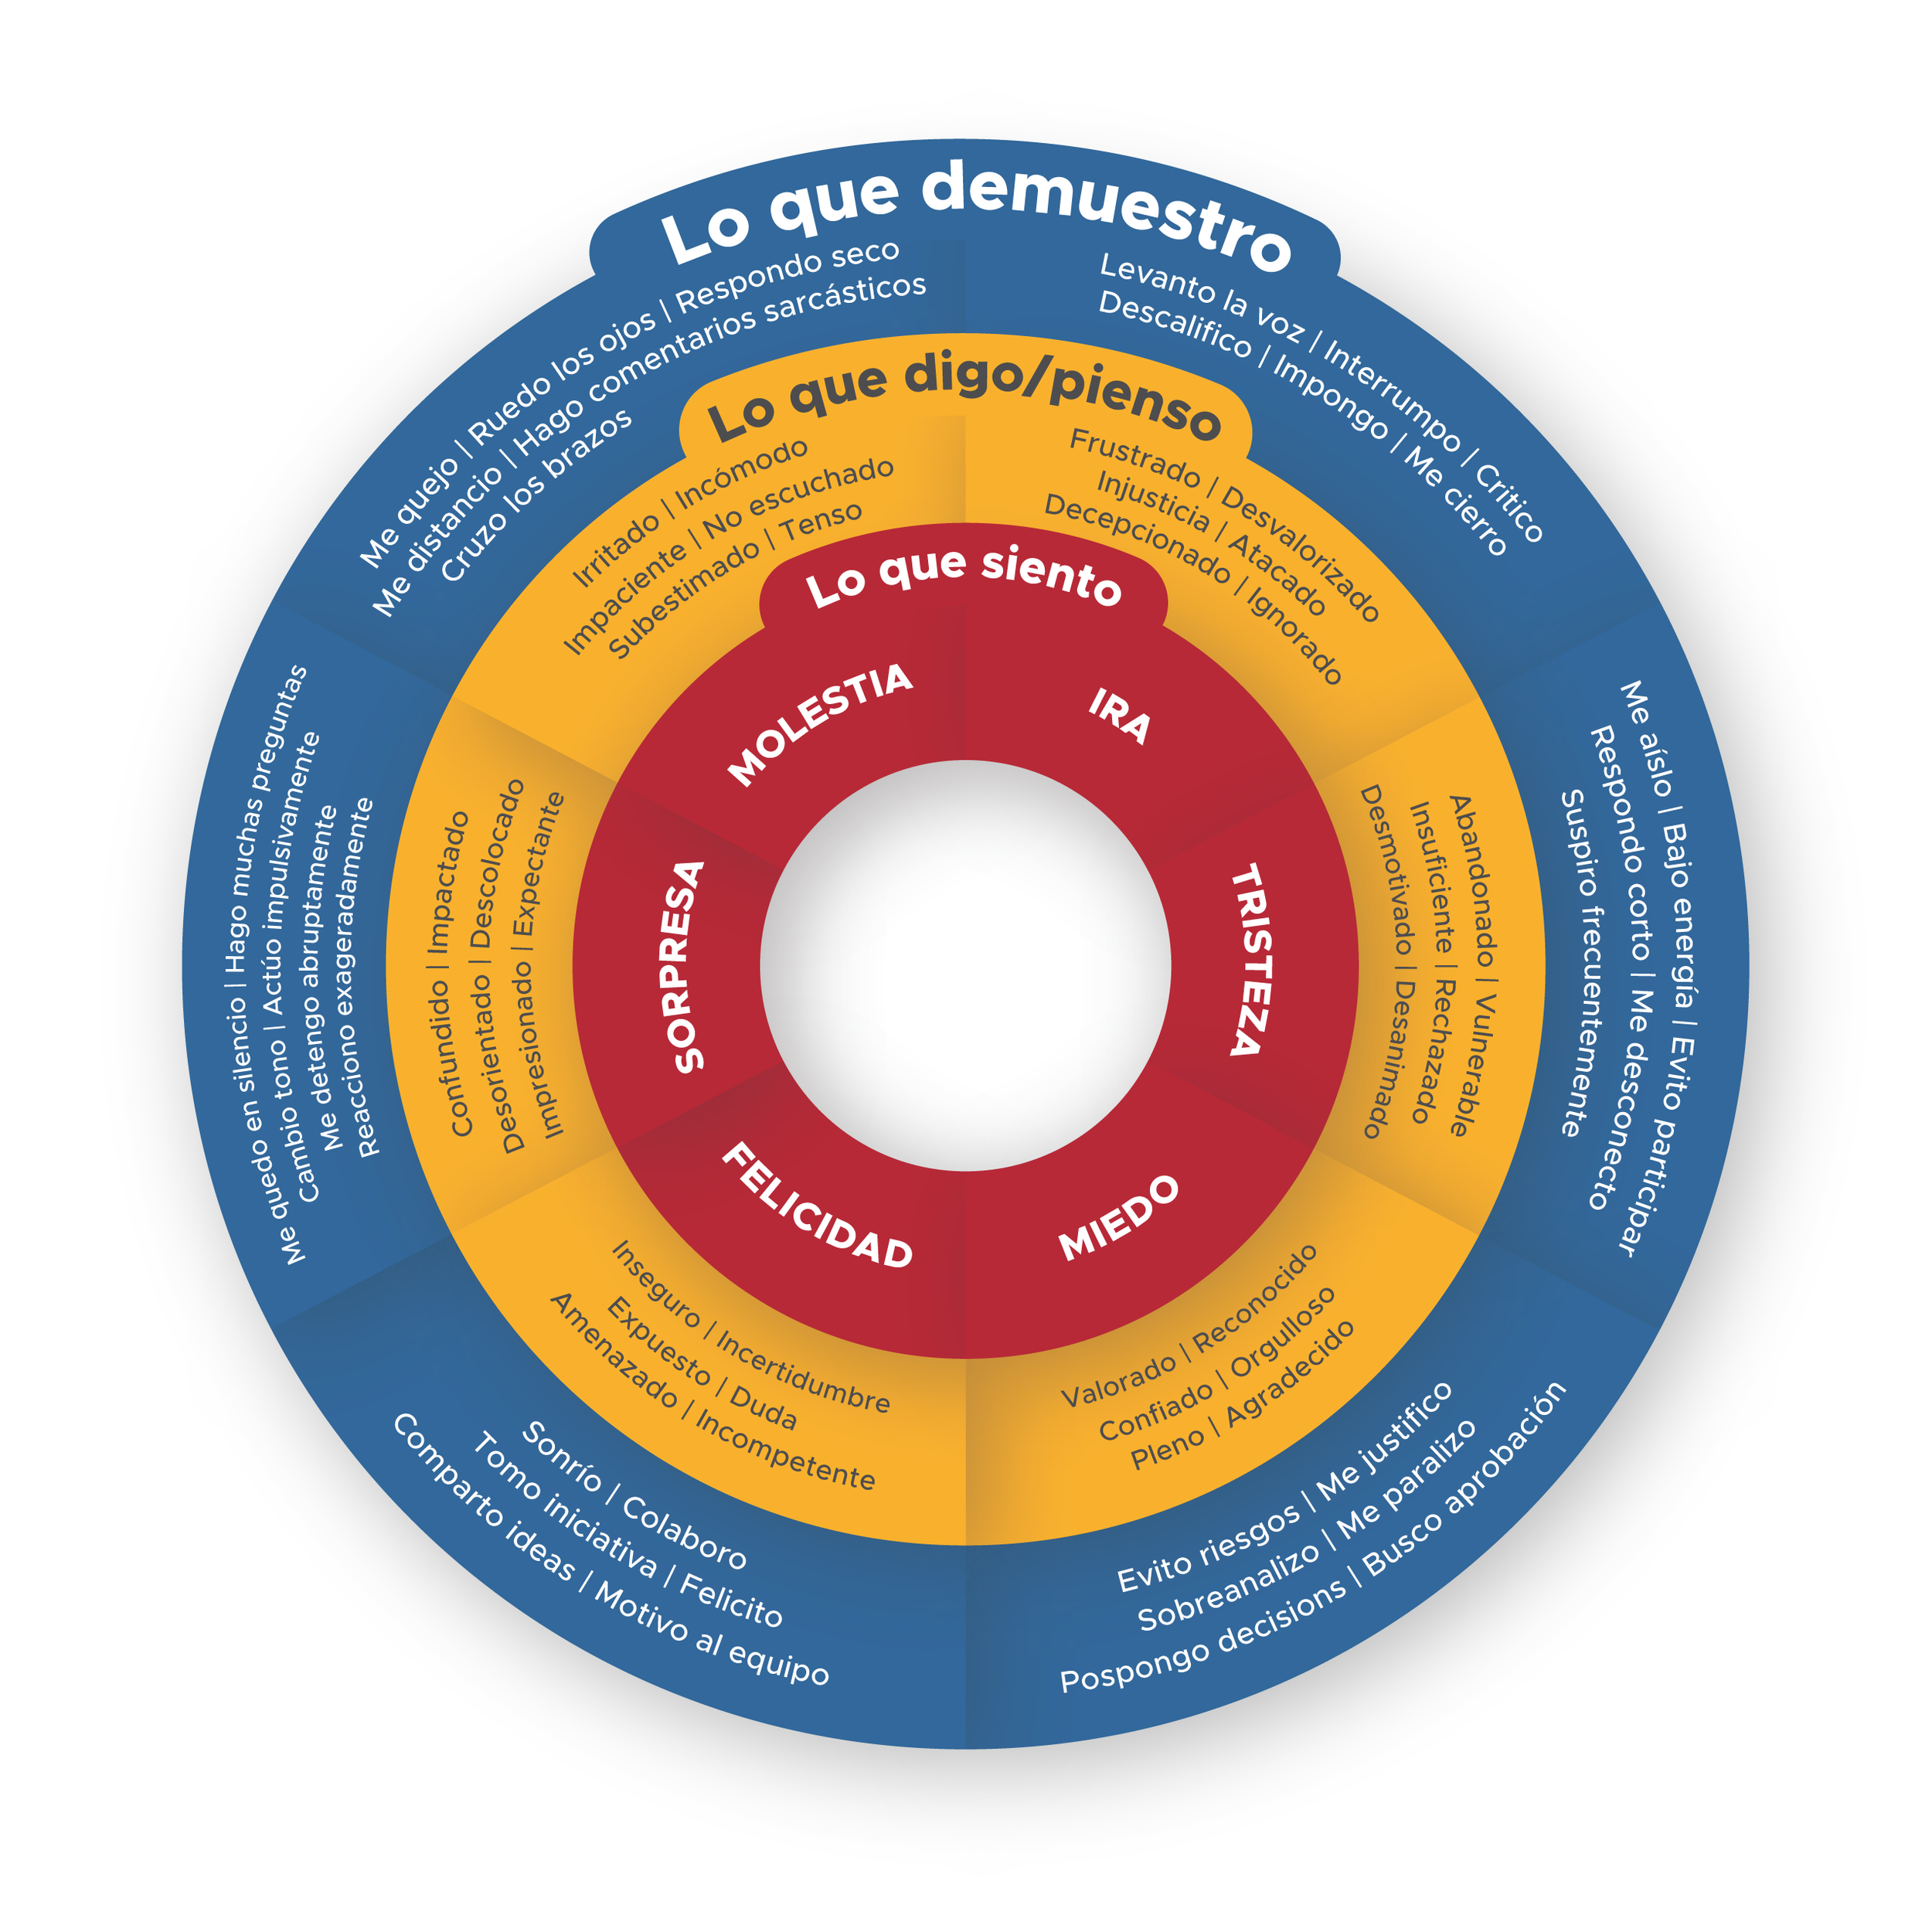
I recently designed this circular infographic to help visually communicate the different emotional and behavioural states someone may experience in a particular situation.
The challenge was to take a large amount of written information and transform it into something that could be understood quickly and intuitively. Using a layered, colour-coded circular structure, I created a clear visual journey from thoughts and emotions, through to feelings and behaviours, helping the viewer understand how each area connects.
A great example of how thoughtful information design can turn complex content into something engaging, accessible and visually impactful.